TradingView has evolved into one of the most widely used and powerful platforms for technical analysis and charting, serving traders and investors across all experience levels. It supports a wide range of global exchanges and offers a comprehensive suite of features. These include access to fundamental data on various instruments, the ability to execute trades directly through a broad selection of brokers, and the ability to set up highly customizable alerts. Additionally, TradingView’s exclusive Pine Script language allows users to develop custom indicators and strategies, empowering them to tailor their analysis to meet specific needs.
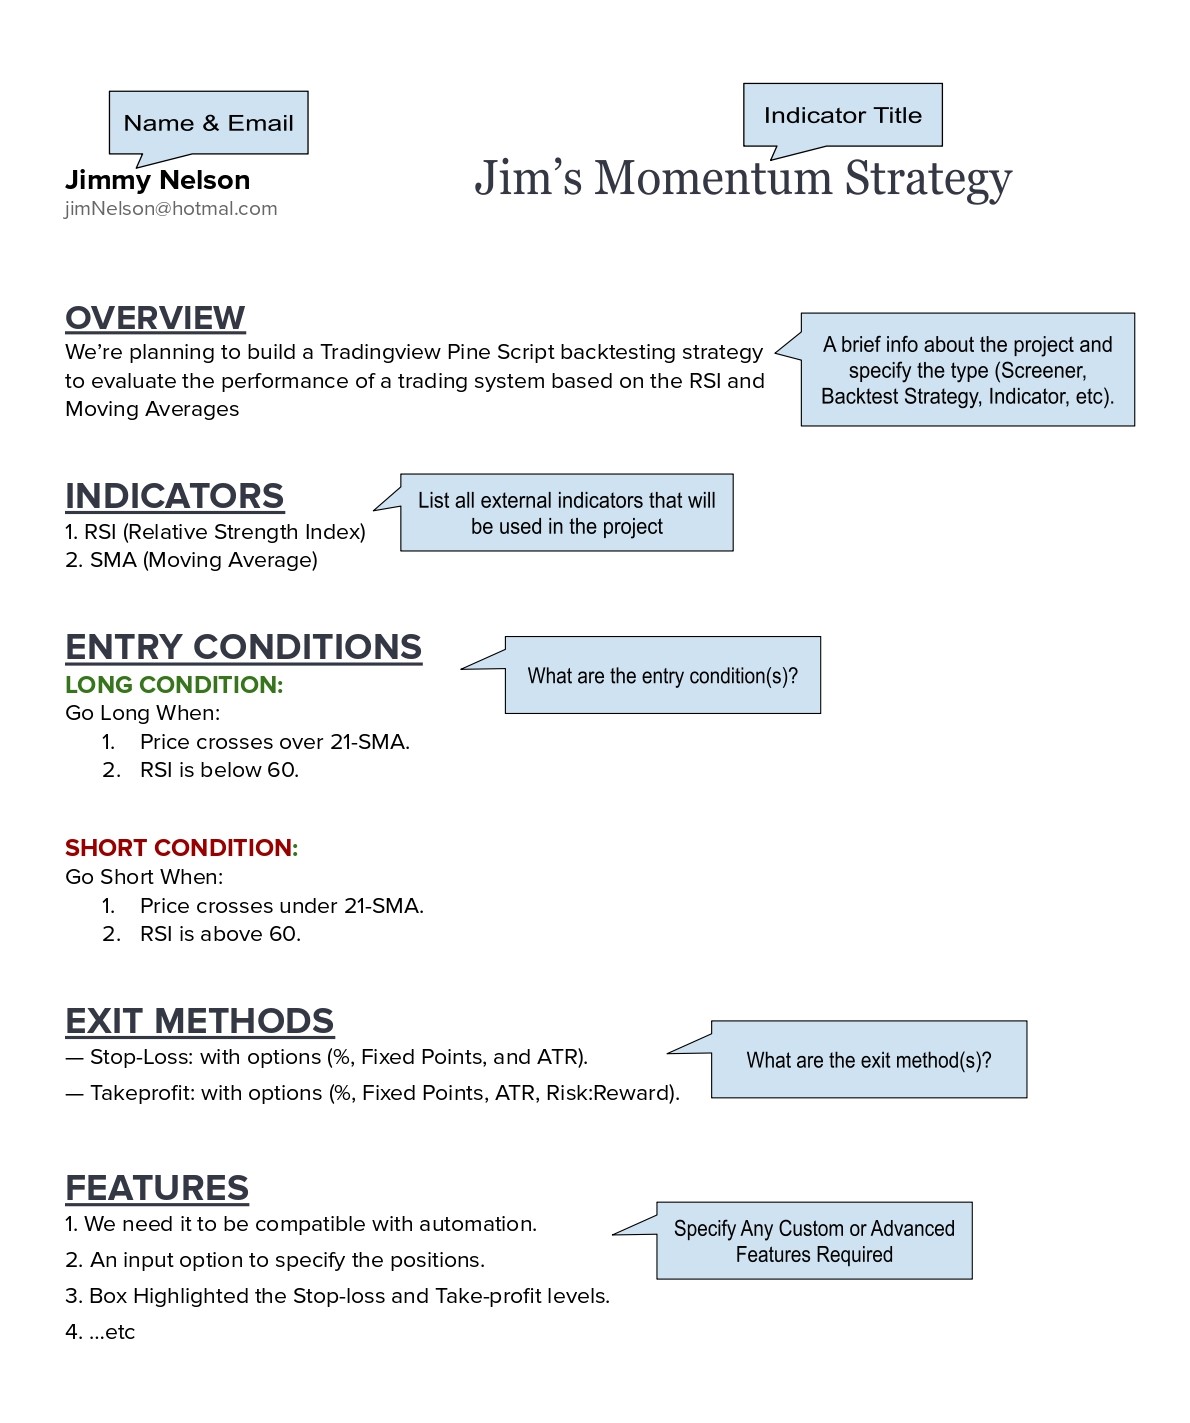
Project Description Guidelines
The best way to write a proposal is to first understand your needs, and then break down the idea into clearly defined requirements and steps. We always recommend following this type of formatting below to ensure smooth and efficient delivery
The Screener table is a feature that can be developed using Pine Script to create dynamic tables for monitoring and tracking various financial instruments. It integrates technical indicators, levels, or signals, helping traders keep track of multiple instruments at a selected timeframe.
⯀ Monitoring: A screener allows the simultaneous monitoring of tens of symbols simultaneously.
⯀ Spotting: It can be tailored to identify trading opportunities based on a customized strategy.
⯀ Capacity: Each screener table supports up to 40 symbols per timeframe.
⯀ Sorting: Create custom options to automatically sort and rank symbols. (upon request)
⯀ Alert: Ability to create alerts can be integrated into the screener. (upon request)
⯀ Multiple Tables: It’s possible to add several screener tables to a single chart.
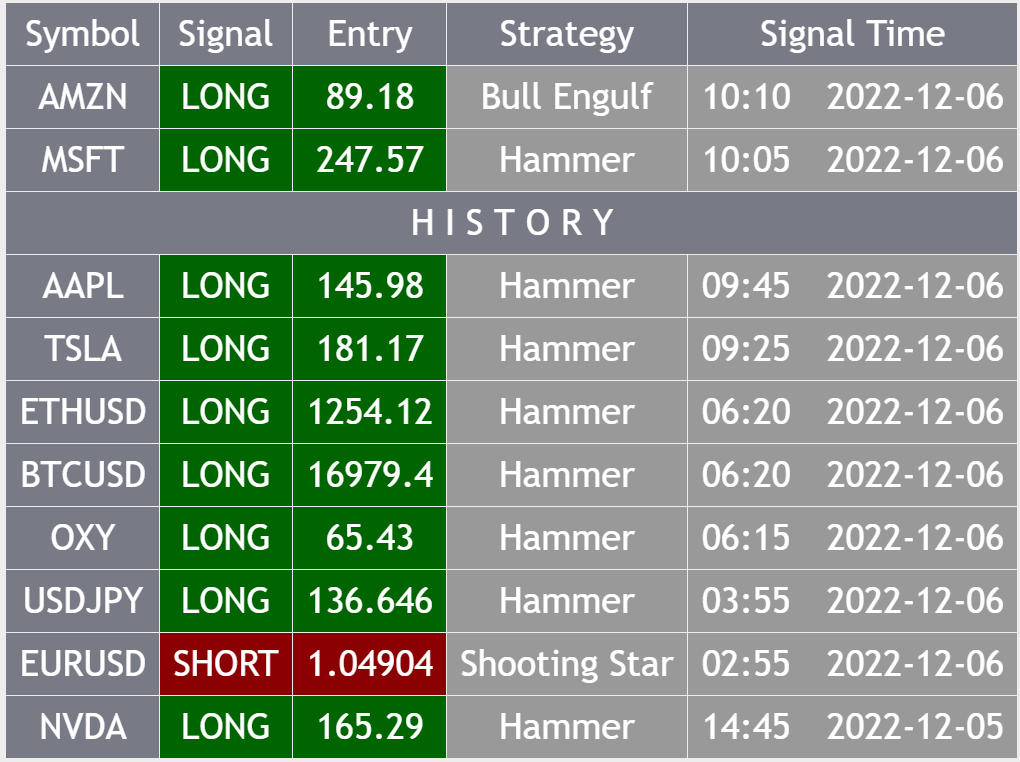
Multiple Signal Screeners On Single Chart Windows
Screen up to 40 symbols on each table (Example)
Strategy Screener (Example)
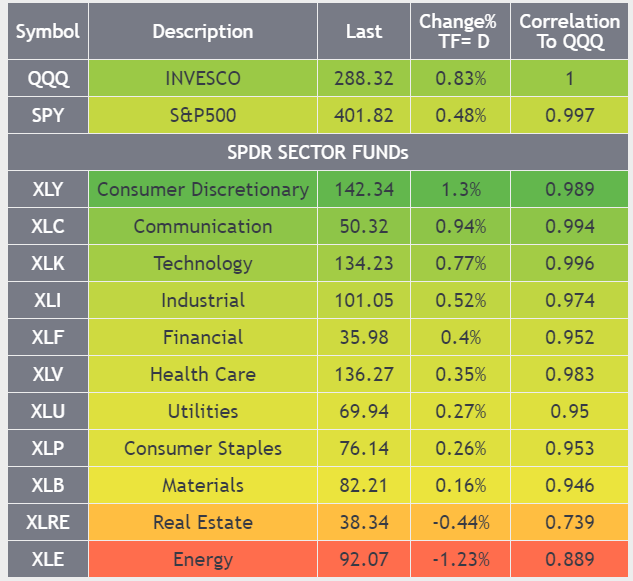
Monitoring Market Sectors (Example)
Backtesting Trading Strategy
Backtesting is a method used to assess the effectiveness and profitability of a trading strategy by applying it to historical market data. It helps traders see how their strategy would have performed in real-world scenarios, allowing them to refine and optimize it before risking actual funds.
TradingView’s “Strategy Tester” provides detailed reports on backtested strategies, displaying key metrics like profit, loss, win rate, and risk ratios. These insights help traders identify the strengths and weaknesses of their strategies, making it easier to optimize them for future market conditions. The tool simplifies the backtesting process and is valuable for traders of all experience levels.
An indicator is a technical tool used to analyze price movements based on real-time or historical data of a financial instrument. It performs mathematical computations and displays the results on a chart in various forms, such as lines, colored candles, labels, geometric shapes, points, or columns. Indicators help traders identify key market signals, and they can be customized to trigger alerts when specific criteria are met, allowing traders to respond quickly to potential opportunities or risks.
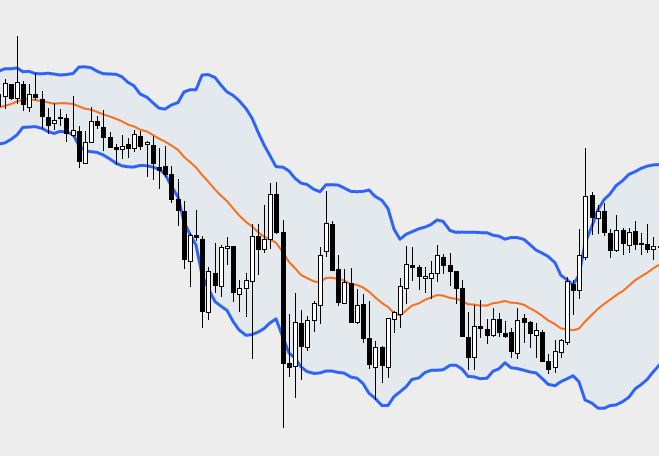
Chart Indicator
A chart indicator refers to those can be applied directly to the main chart window
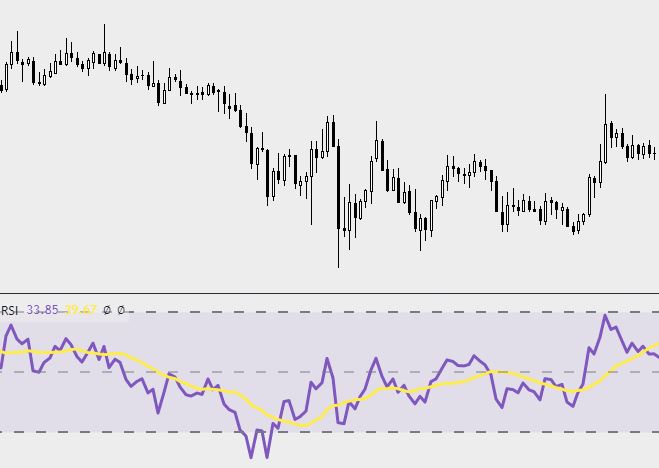
Sub-Chart Indicator
A sub-chart indicator refers to those can be applied to the secondary chart window.
Strategy Indicator
A strategy indicator is a non-backtest form that focuses on generating trading signals.
 Project Description Guidelines