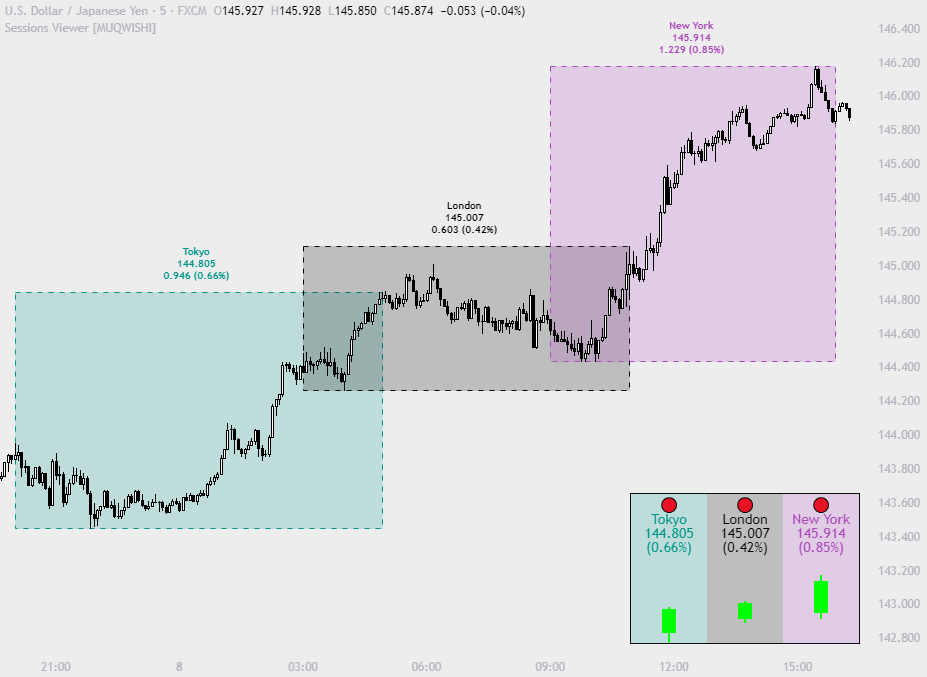
Built to highlight up to four trading sessions on the chart and display a summary panel showing candle or bar pattern of a session, offering quick insights into session-based volatility.
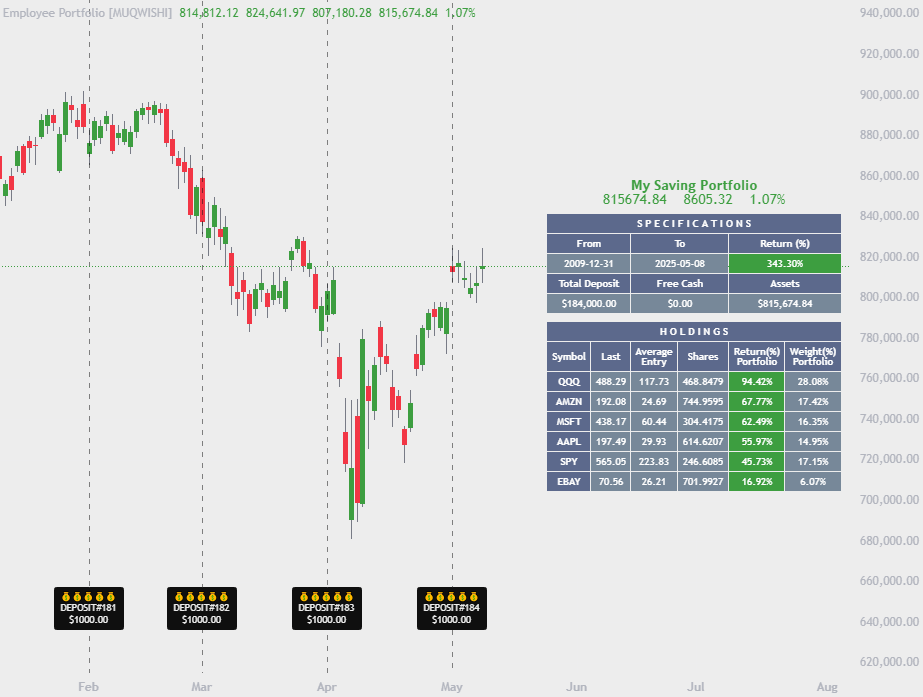
A tool designed for employees to build a long-term investment portfolio with recurring deposits, customizable asset weights, and performance tracking, offering insights through portfolioindex values, holdings tables, and charts.
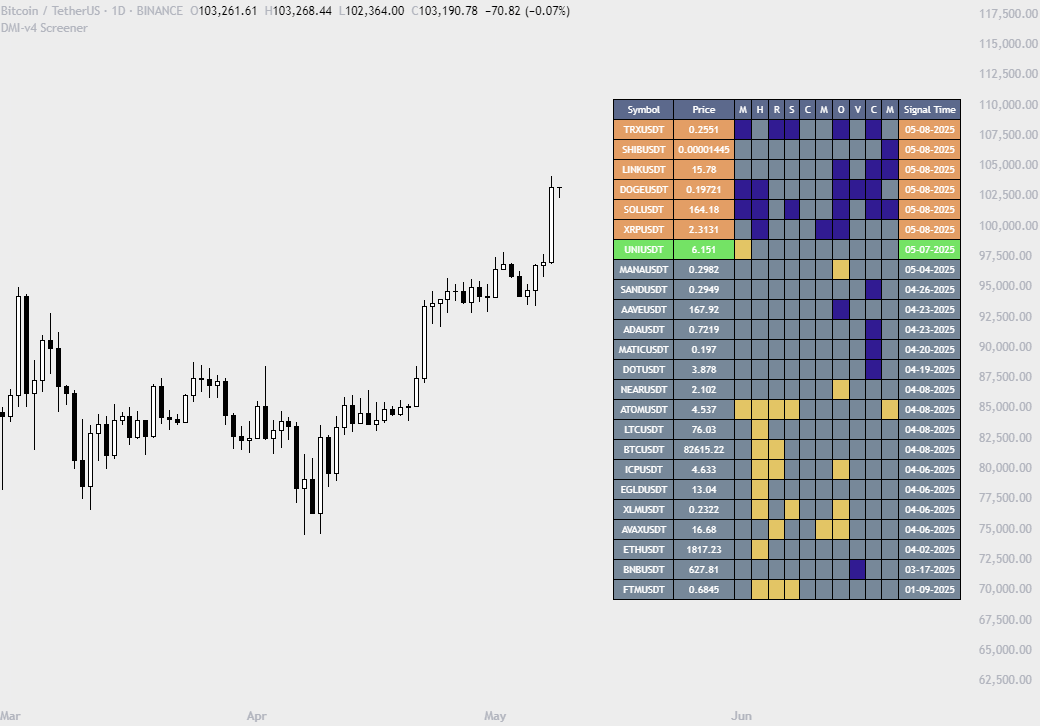
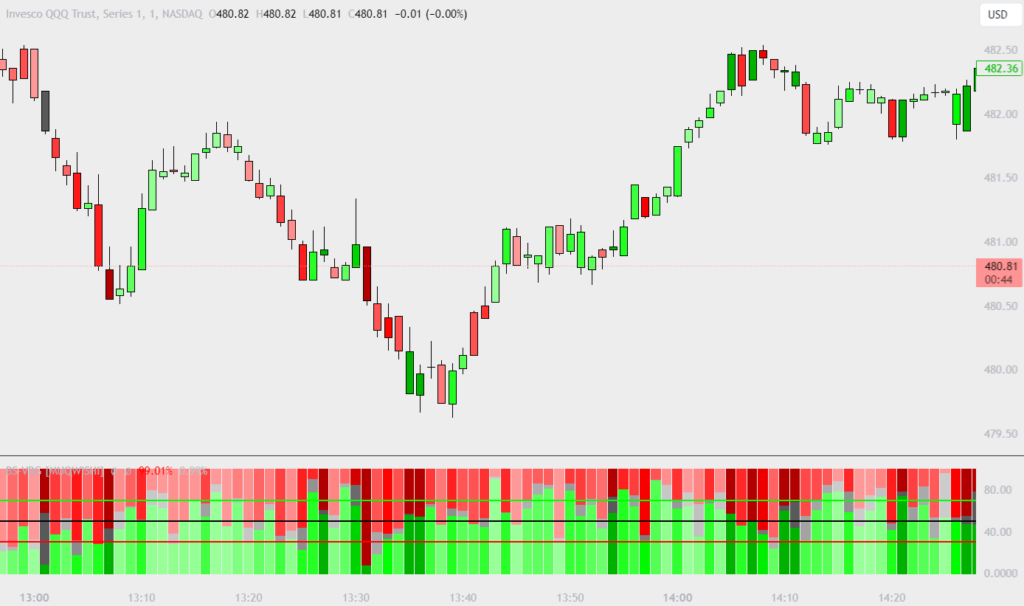
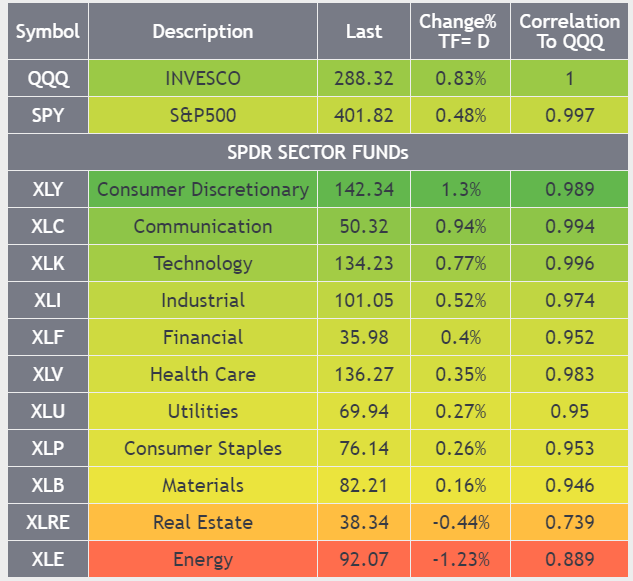
A real-time screener for up to 24 symbols, based on the “Divergence for Many Indicators v4”. Designed to detect divergence signals across a range of indicators including MACD, HIST-MACD, RSI, STOCH, CCI, MOM, OBV, VW-MACD, CMF, and MFI.
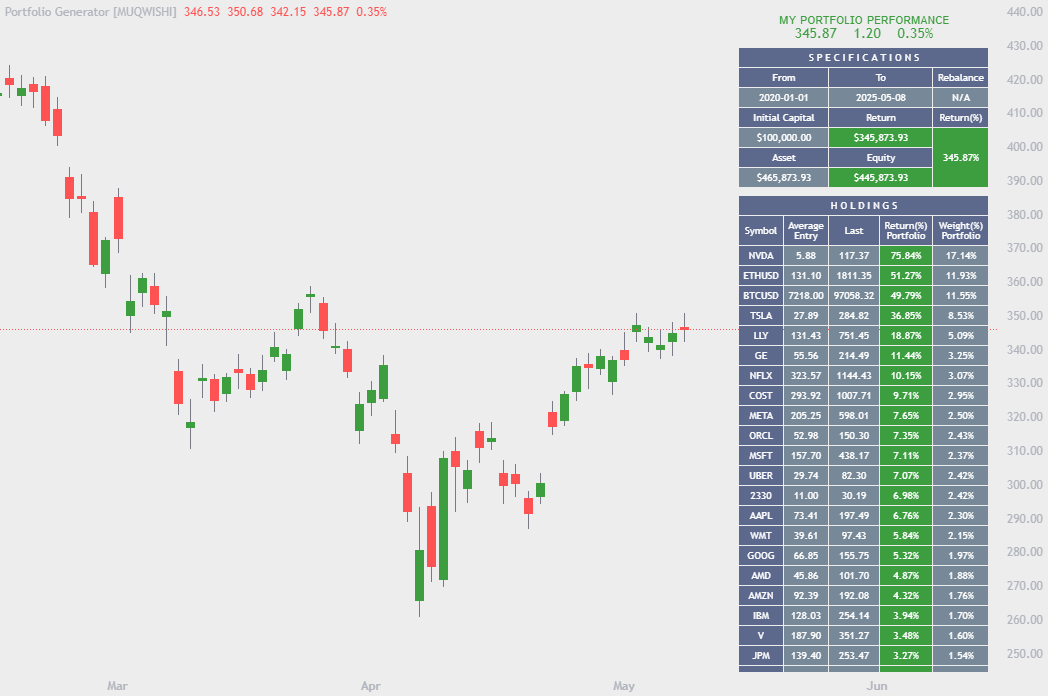
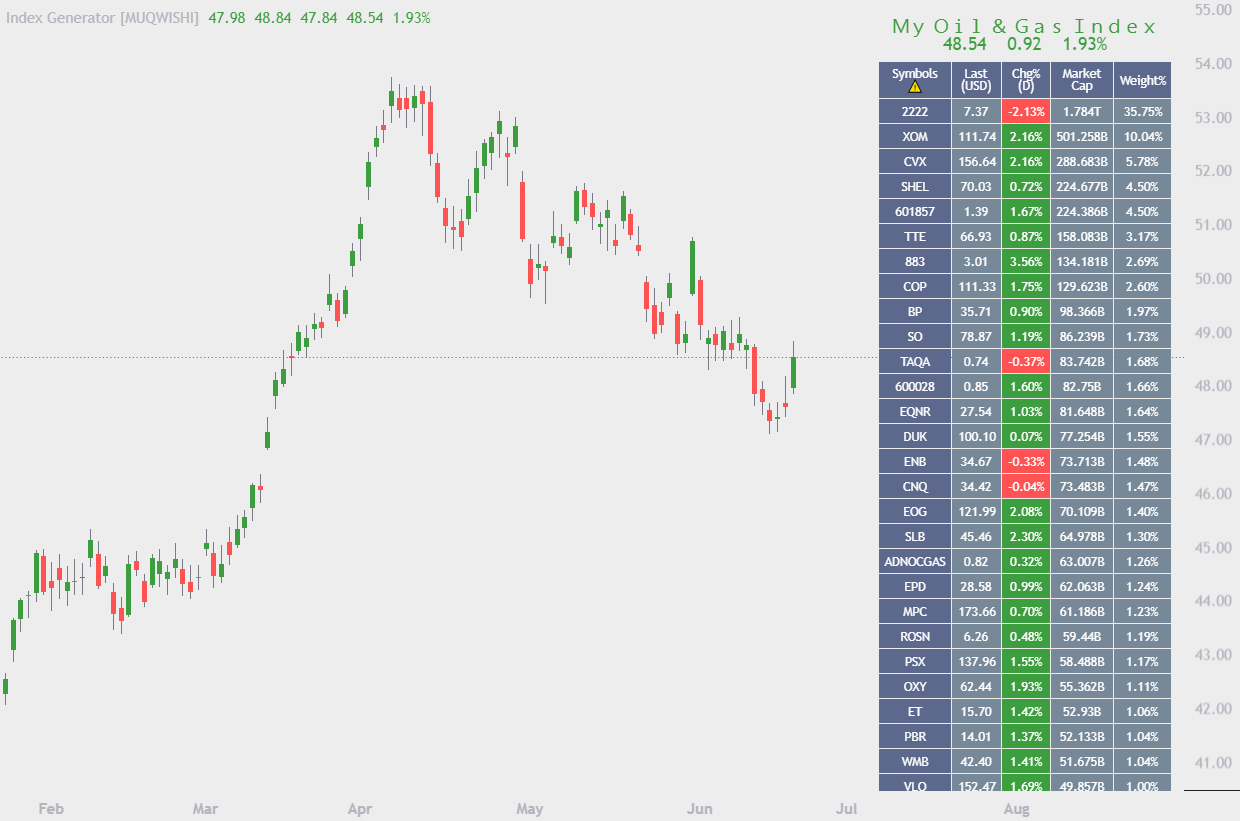
Builds a custom portfolio index by selecting global securities, assigning initial weights, and optionally rebalancing. It aims to serve as an approach for tracking performance and conducting research of the portfolio.
provides a detailed analysis of volume in bars using a low timeframe, such as a 1-second, to measure the dominance of buy and sell for each bar. By highlighting the balance between buying and selling activities.
Builds a custom index, contains a list of preferred holdings. It aims to serve as an approach for tracking performance, conducting research, and analyzing specific aspects of the global market.
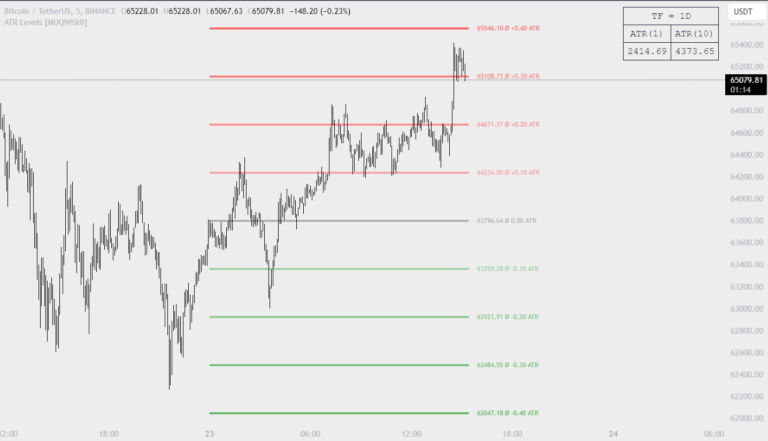
Produces a sequence of line levels above and below the Center Line (reference level). They are sized based on the instrument’s volatility, representing the average historical price movement on a selected higher timeframe using the average true range (ATR).
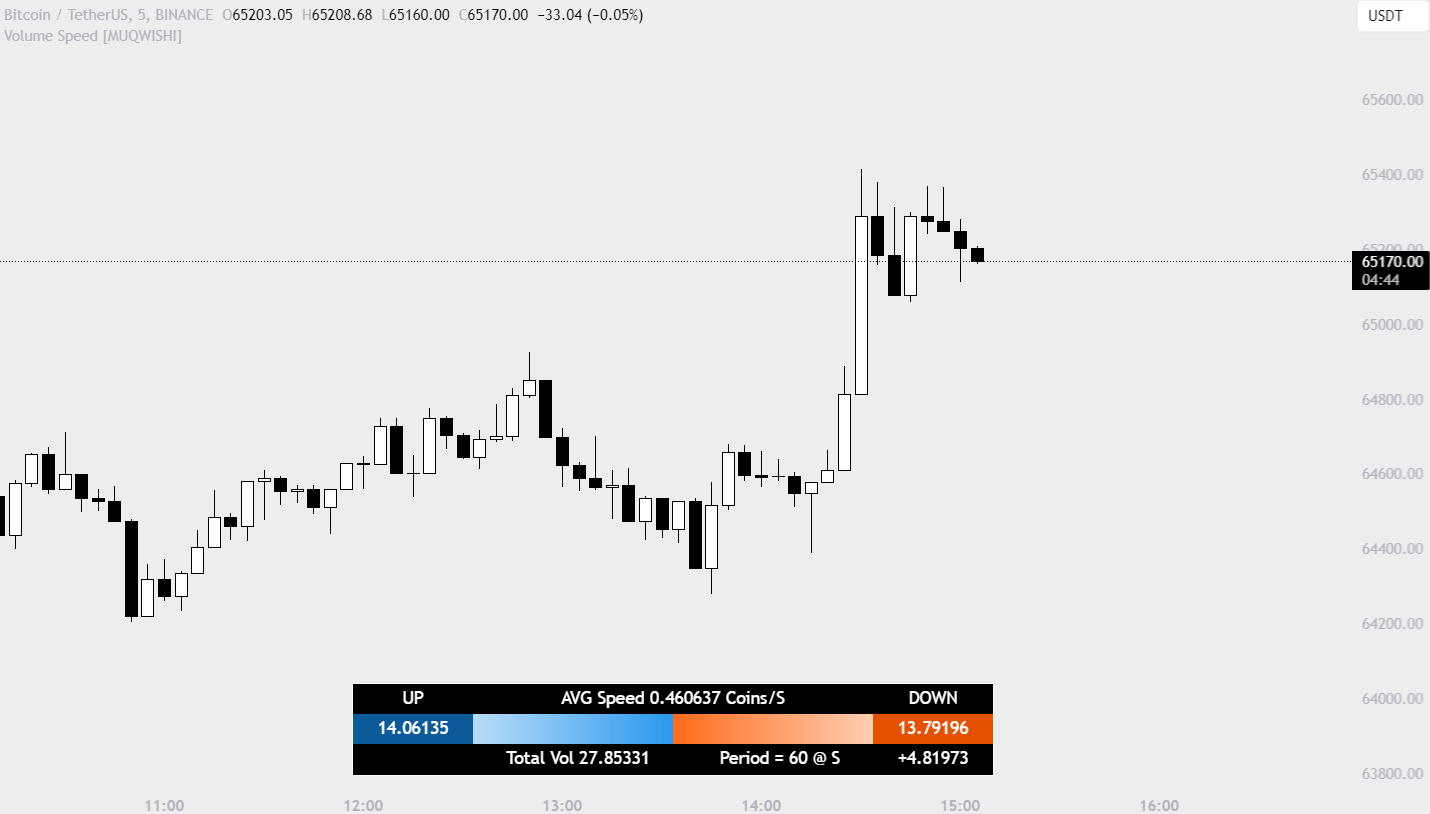
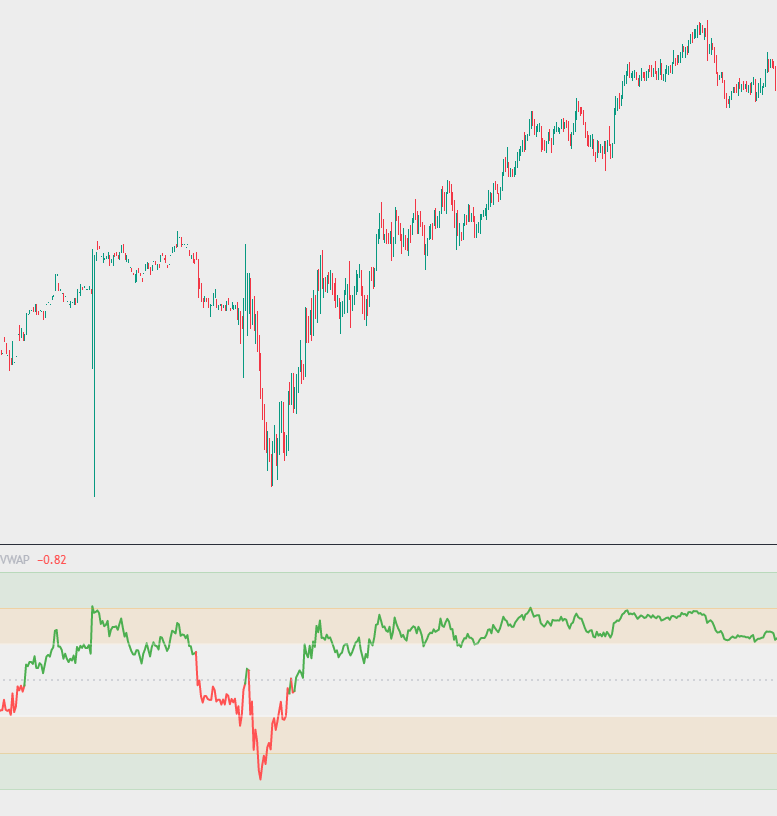
Generatesdetermining the dominance of volume flow over a selected length and timeframe, indicating whether buyers or sellers are in control. In addition, it detects the average speed of volume flow over a specified period.
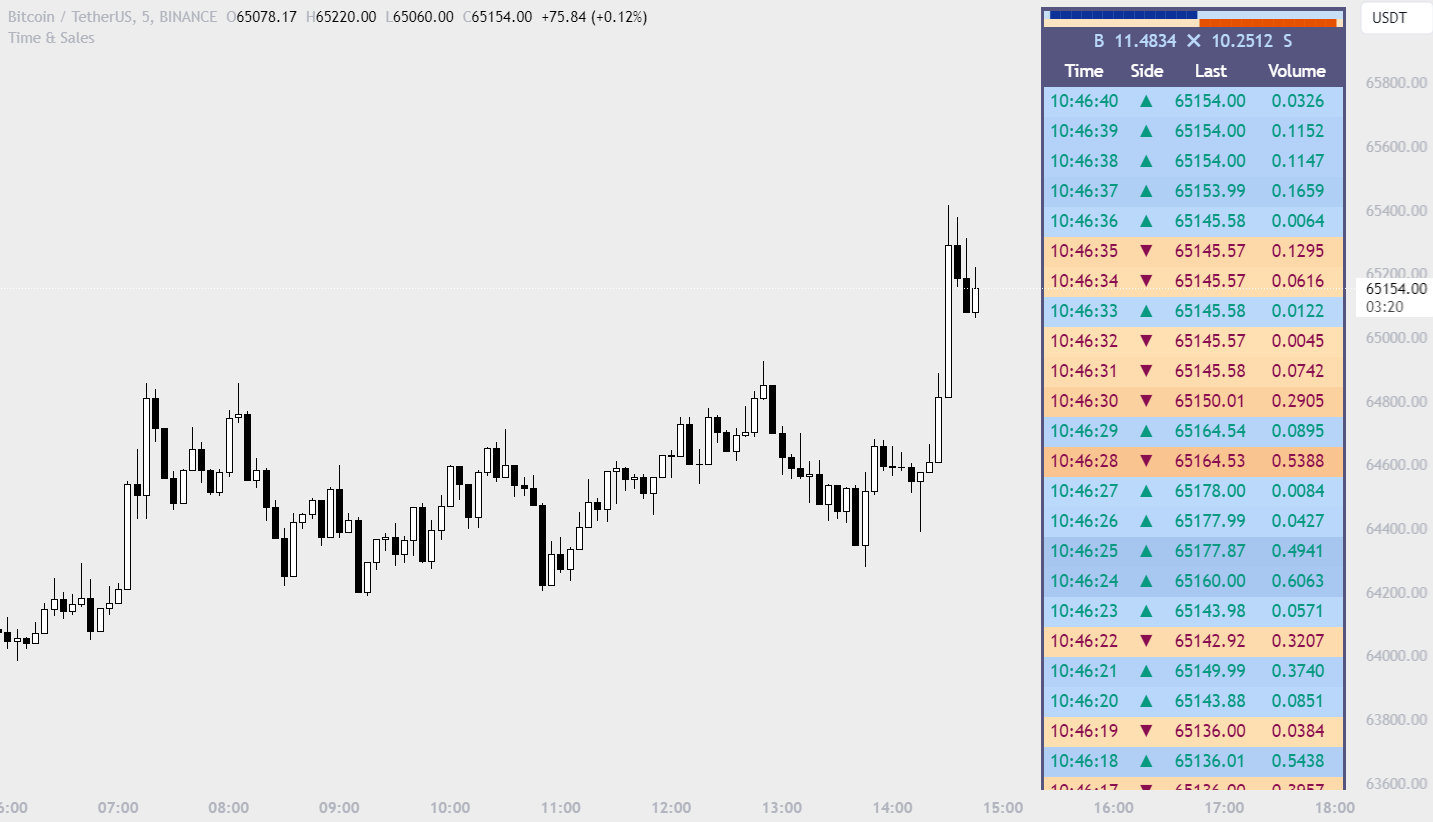
Generates trade data, including time, direction, price, and volume for each executed trade. This information is typically delivered in real-time on a tick-by-tick basis or lower timeframe, providing insights into the traded size for a specific security.
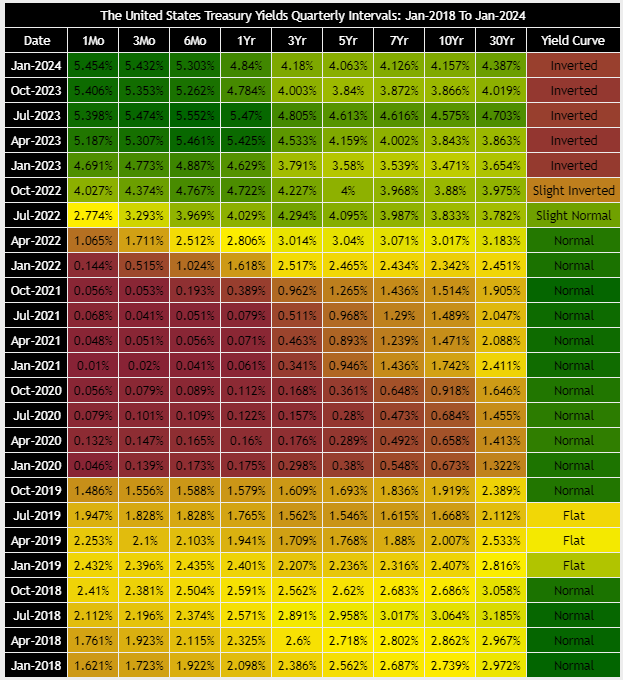
Generates a heat map table, showing treasury yield bond values corresponding with dates. Last column, it presents the status of the yield curve, discerning whether it’s in a normal, flat, or inverted configuration.
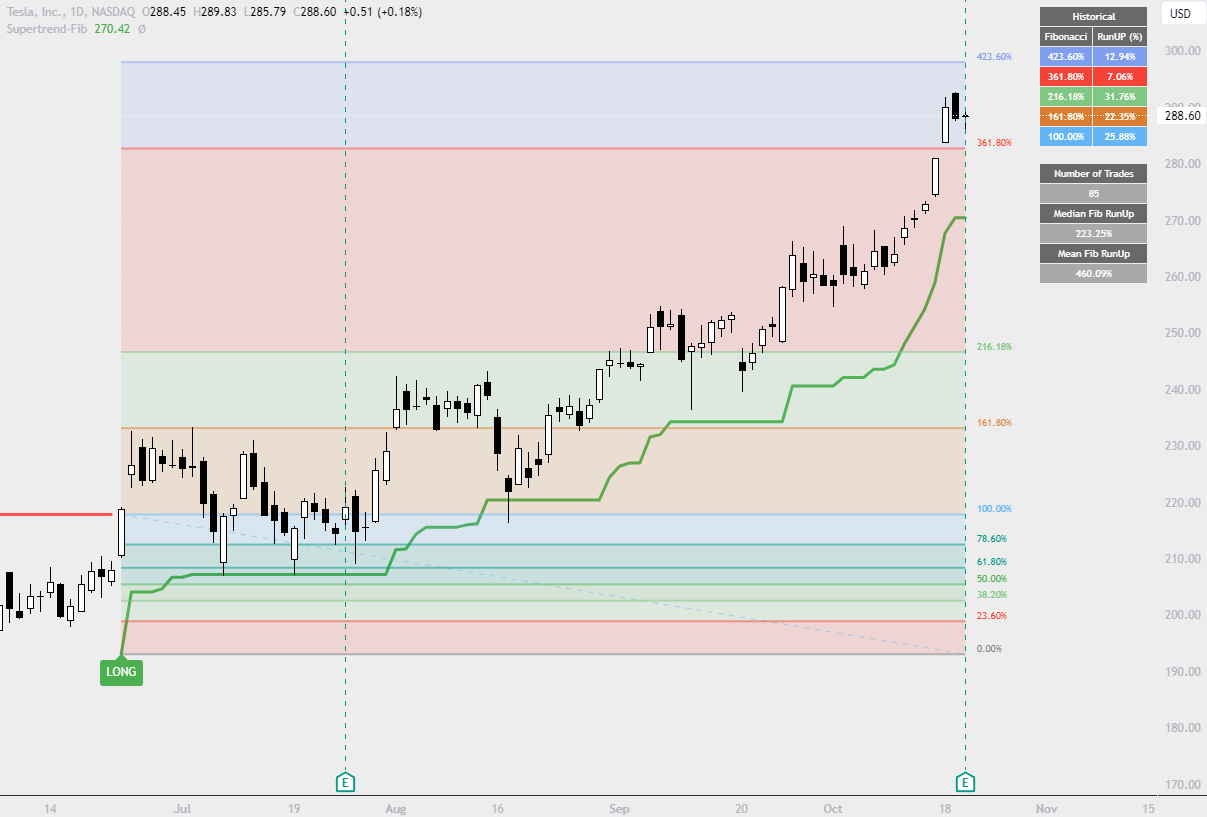
Fibonacci levels on Supertrend provides a sequence of levels starting from 0% to 100% in addition to extension levels. 0% is measured to be the initial of Supertrend line, and 100% is a distance of difference in between long and short Supertrend lines.
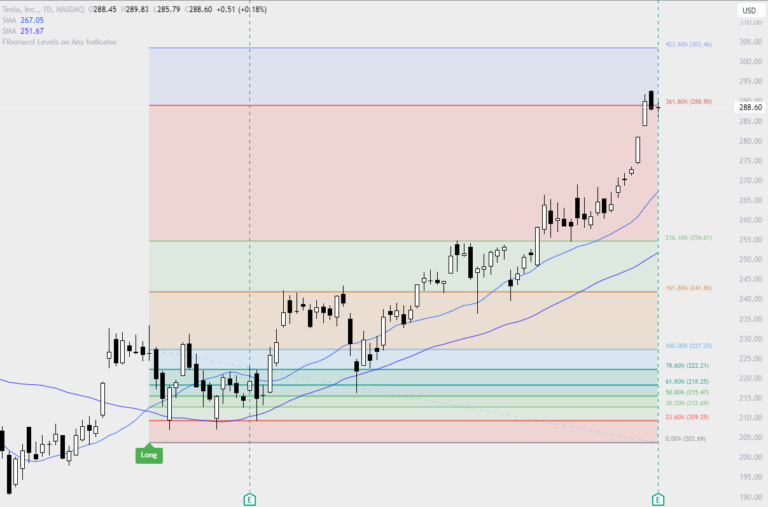
Fibonacci Levels on Any Indicator can be applied to any indicator to draw Fibonacci levels based on provided conditions of two price points to produce a sequence of horizontal line levels starting from 0% to 100% in addition to extension levels.
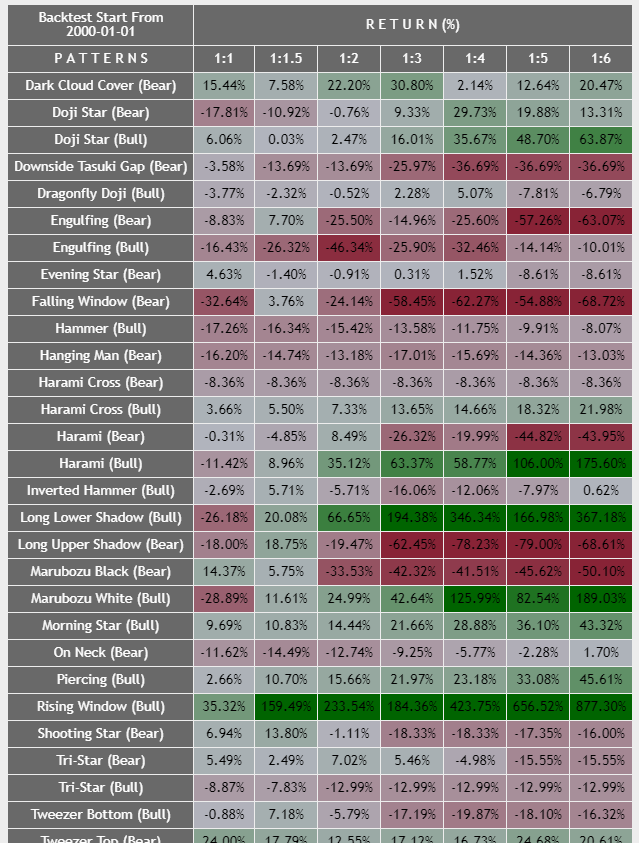
The table generates a clear visualization of the historical return percentages for each candlestick pattern strategy over a specified time period. This indicator may be taken as a launching point for in-depth research into candle formations.
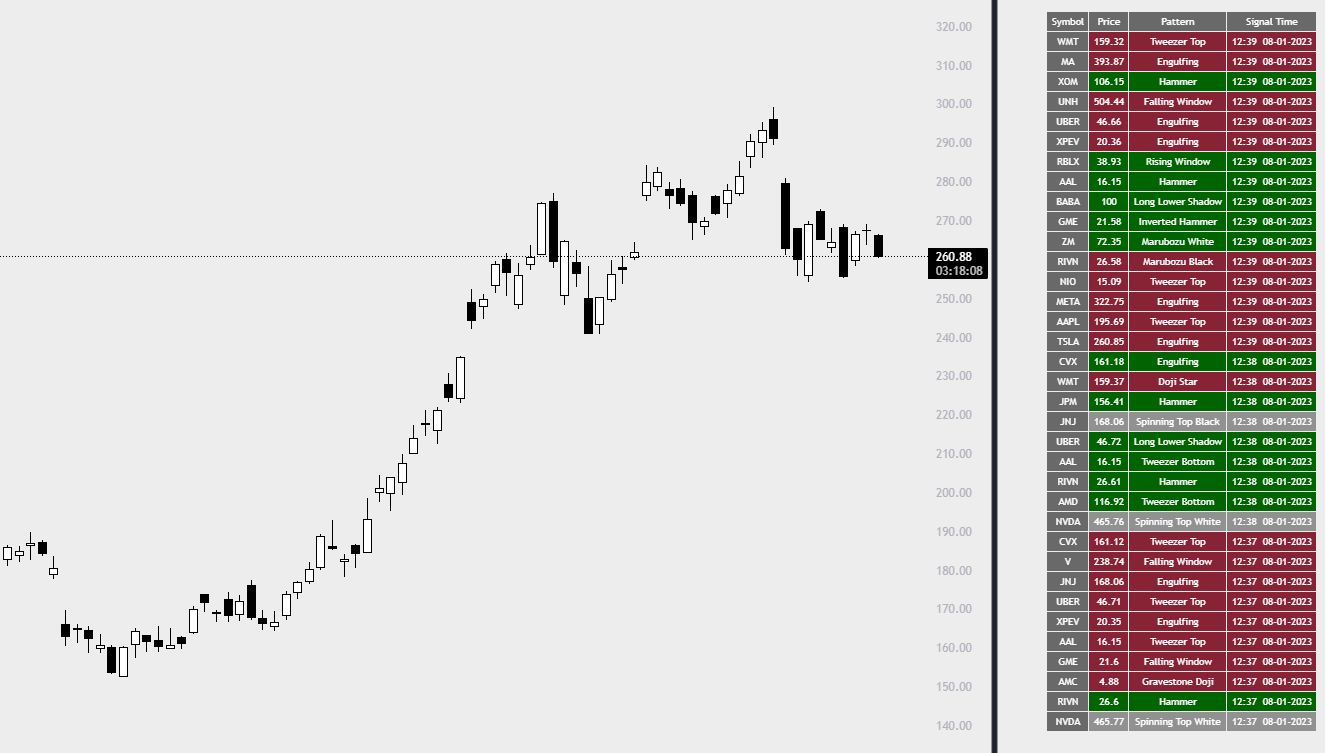
Candlestick Patterns Screener has been designed to offer an advanced monitoring solution for up to 40 symbols. Utilizing a log screener style, it efficiently gathers information on confirmed pattern occurrences and presents it in an organized table.
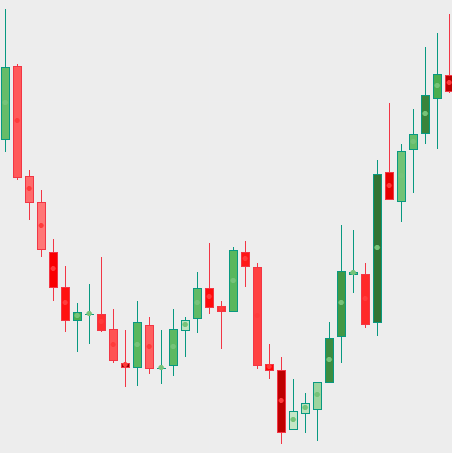
The Volumetric Candles indicator works to weigh each candle instantaneously and updates the candle’s color from lightness to darkness based on the rate of the standard deviation.
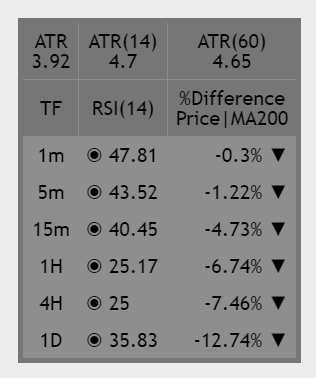
The table starts with the ATR daily section. The second section of the table, showing RSI values at the most common upper timeframes, and the different percentages between the current price and long-term moving average entered by the user.
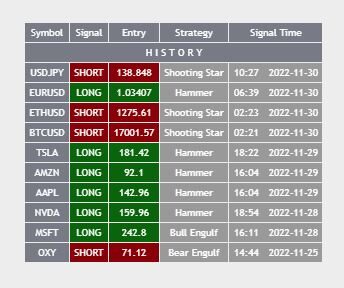
The screener performs scanning customizable entered 10 symbols with 4 different strategies “Hammer at Low of the day”, “Shooting Star at High of the day”, “Bull Engulfing at Low of the day”, and “Bear Engulfing at High of the day”.
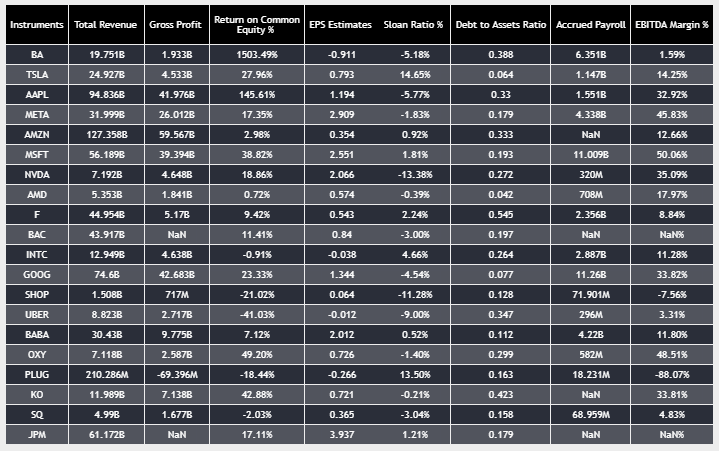
The Financial Data Spreadsheet indicator displays tables in the form of a spreadsheet containing a set of selected financial performances of a company within the most recent reported period.